Growth in Mobile Traffic. The latest statistics

The growth rate of mobile Internet access has exceeded that of initial Internet growth.

Statista has just released a chart to demonstrate this comparison. The compound annual growth rate (CAGR) figures for global internet traffic between 1997 and 2003, show a 127% annual increase. Mobile IP traffic however, has now reached an annual growth rate of 146%.

Mobile traffic in 2012 is 12 times higher than the total global Internet traffic of 2000.

The increased sales of smartphones and tablets, the increasingly frequent use of handhelds for second screening, social networking, pre-purchase researchm.commerce and mobile video have all contributed to this growth.

Mobile Internet traffic is fast outstripping desktop traffic. Analysts agree that there is a massive gap between the time spent on mobile compared with the advertising spend. For television, the figures are comparable. Advertising on mobile is still lagging, with the adspend less than 20% of the time spent online by consumers.

mobile-internet-traffic-growth


Read more:

To maximise the impact of your brand in mobilecontact us today.


Sources:
Statista

What does “responsive” really mean?

In speaking with numerous people recently, it is clear than many do not understand the meaning of the term “responsive design” as applied to a web presence. Resizing and responsive are two entirely different animals. Let me explain.

A responsive site is one which responds to the width of the browser.

That does not mean that the site simply shrinks to a miniaturised version, but that it dynamically reformats to present the most appropriate (and readable) content.

The growth of Mobile

When you last used public transport, went to a concert or were in a public place, what did most people hold in their hands?

No one will deny that handheld devices, including tablets and smartphones, have transformed the marketplace. Five times more smartphones were sold globally in 2012 than desktop computers1. The time spent connected to the Internet via handhelds is increasing as time via desktops decreases2, and increasing numbers are “second screening”3 on a handheld while watching television.

Yet, because 99% of desktop and laptop users are viewing a screen of 1024 x 768 pixels and above4, most web developers continue to design for that size, or in a fluid design which scales up (and only up) from that width, entirely disregarding mobile.

Mobile sites

Enterprises which recognise the need to serve different format (and sometimes tailor content and functionality) to their customers, are developing ‘mobile’ sites, custom-designed for smartphones and handheld devices, and utilising a separate content management system (CMS)5. This is necessary if the functionality of your stakeholder interaction demands it.

However, for the vast majority of brands, there is a far more efficient approach than either of these two extremes.

Responsive design

Developing a web presence in a responsive design, ensures that the site will resize (up or down) to the width of the browser and present the navigation in a highly legible, pull-down-menu format.

The best responsive sites will respond to the changing width of the screen whether caused by device orientation (on a handheld) or browser resizing (on a desktop or laptop).

Panels containing images and text will reformat to horizontal or vertical, as appropriate, and the number of panels will vary according to width (e.g. Pinterest)6. Sometimes the images themselves will resize (e.g. YouTube)7.

That all of this can be achieved within a single CMS is a huge commercial benefit, generating high ROI both from the lower initial investment and the reduced resources required for ongoing managment. There is no need for dual input when one CMS can manage sites for all desktop and mobile platforms.

If the platform used is as well-tested and ubiquitous as WordPress, even the SEO will be exceptionally efficient!

Navigation

The horizontal main nav and pulldown menus on the desktop, transform into a bold, highly legible single pulldown menu on handheld devices.

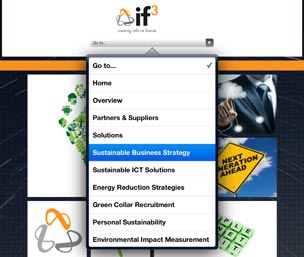
if-3_nav_d if-3_nav_h

Image panels

Large images and text are progressively scaled ..

if-3_p1


to conform with available screen width on handheld devices

if-3_p2 if-3_p3 if-3_p4

Image and text panels

Where text and images are connected, multiple vertical columns will convert ..

if-3_C3

to horizontal columns on a tablet and vertically stacked panels on a mobile phone.

if-3_C2 if-3_C1

Footer nav

On a desktop, laptop or landscape tablet, footer nav appears as multiple columns, but

comsec_f3


.. transforms into a single vertical column on a portrait tablet or smartphone.

comsec_f1

Digital Tsunami can help you to prepare a strategy and present your brand effectively across all online and offline media. Contact Digital Tsunami today.

Sources:
1.i Australian Financial Review (AFR) report on International Data Corporation (IDC) data of 2012 hardware shipments: 722 million smartphones, 148.4 million desktop PCs, 128 million tablets.
1.ii Google MobileThinking
2.i Nielsen’s “Australian Multi-screen Report Quarter 4 2012”
“Demographic variation is evident. The largest segment of each age group has a distinct preference for the medium on which they watch video. 50-64 yo watch television (24%), 35-49 yo watch the Internet (28%) and 25-34 yo watch on a mobile phone (37%)
2.ii BusinessWire ‘time spent connected by device’
2.iii Connected Intelligence ‘in-home Internet connected devices’
3.i Deloitte ‘second screening’
3.ii GigaOm “How new devices, networks, and consumer habits will change the web experience”
“Mobilizing web design is a catch-22; adjusting to design challenges is costly, but not adjusting is equally costly, because a poor mobile web experience results in a loss of revenue.”
3.iii GigaOm Up to the end of November 2011, camera-equipped smartphones took 27% of photos, a significant increase from 17% in 2010. For many people, smartphones have replaced Point-and-shoot cameras.
4 w3schools ‘browser screen size’
5 ThinkWithGoogle ‘Mobile Planet interactive statistics’
6 Pinterest
7 YouTube
8 comsec-offshore.com
9 if-3
10 jennadearnessdark.com

The Mobile Consumer – 2012 statistics

Nielsen has just released a report “The Mobile Consumer. A Global Snapshot, February 2013

The research covers 9 countries across 5 continents: Australia, Brazil, China, India, Italy, Russia, South Korea, United Kingdom, United States.

Interesting data reveals world leadership by the rapidly developing BRIC countries:

  • In Brazil, 75% of the respondents use their mobiles for social networking, far higher than any other country in the survey
  • 97% of the population in Russia (age 16+) owns a mobile phone, (only South Korea is higher at 98%)
  • The country where mobile video viewing has most affected TV viewing is India, where 28% of respondents reported watching less traditional TV
  • The highest frequency of mobile video views is in China, where 17% of smartphone owners watch mobile video more than 3 times a day

The statistics include:

  • owner demographics
  • ownership of types of phones
  • multiple device ownership
  • mobile phone plans and costs
  • purchase location and criteria
  • mobile apps used
  • mobile video hours and methods
  • the impact on TV viewing time
  • mobile advertising

According to Nielsen’s Global New Product Report (January 2013), the Internet has an increasingly important influence upon consumers researching new products. The use of the Internet by prospective buyers is significant in categories such as electronics (81%), appliances (77%), books (70%), music (69%), new clothing (69%) and cars (68%).

In Nielsen’s just released Australian Automotive Report 2012, data shows that Australians’ research of new car purchases on mobile devices has doubled (29% up from 14% last year).

Most of this research is still via laptops (64%) and desktop computers (62%), while research increased via mobile phones (29%) and tablets (26%).

Among new car buyers who have engaged with organisations on social platforms, 28% have engaged with a car brand, up from 18 per cent in 2011. However, the study of over 1,000 car buyers, indicated that Australians still prefer visiting dealerships over online research.

The Global New Product Report even charts a formula for success with online sales. On page 20, a circular diagram itemises the components which contribute to the greatest product sales. Perhaps unsurprisingly, these include: a clear, concise message; superior quality; brand credibility; online accessibility; delivery on promises and product loyalty.

To maximise the impact of your brand in mobilecontact us today.


Sources:

http://www.nielsen.com/us/en/reports/2013/mobile-consumer-report-february-2013.html
http://es.nielsen.com/site/documents/NielsenGlobalNewProductsReport.pdf
http://www.campaignasia.com/Article/337021,more-new-car-buyers-in-australia-researching-via-mobile-nielsen.aspx

Video via Mobile. The latest statistics

Released on March 10, 2013, the Nielsen “Australian Connected Consumers Report 2013” provides insights into the evolving patterns of consumers’ media consumption.

Data includes the aggregate time spent on the Internet per day, connectivity during the hours of the day, how age is reflected in device usage patterns, and the increase in ‘out of home’ Internet access.

In Nielsen’s recently released “The Mobile Consumer. A Global Snapshot 2013“,  extensive statistics demonstrate the increasing extent of video viewing via mobile.

Covering multiple countries, the data reveals that over the last 30 days, almost 100% of mobile phone users had watched at least one video per week, while the most frequent viewers were from China and Brazil, watching 2-3 or more videos per day (37% and 33%respectively).

While respondents in India reported the lowest frequency of daily video views, (14% watched one or more videos a day, compared with 54% in China), it also reflected the greatest reduction of traditional television viewing (28%). Conversely, the UK demonstrated the lowest percentage of viewers reporting a decrease in traditional television watching (5%).

Futurists are predicting that by 2015, the majority of information absorbed online and on handheld devices, will be via video. Visitors to YouTube watch over 1 billion short videos every day! The importance of video is evident in the fact that after Google, YouTube has become the world’s second most popular search engine.

A further Nielsen report on the global impact of women in mCommerce, emphasises that:

  • more Australian women own smartphones (67%) than women in any other country in the world, followed by South Korea (65%), China and Italy (both 57%)
  • 95% of women in developed countries have a cell phone
  • globally, women’s reliance on friends or family for advice on personal finance matters is 25% higher than than men

Social network platforms on mobile phones are enabling far more extensive and rapid social networking with friends and family. The rapid growth of Facebook, Pinterest, Twitter and Vine is a testament to this rapid change in social and consumer behaviour.

If your brand needs assistance with social strategy or video production, contact Digital Tsunami today.

 
Sources:

http://www.nielsen.com/us/en/newswire/2013/10-things-to-know-about-todays-female-consumer.html
http://www.nielsen.com/au/en/news-insights/press-room/2013/australian-connected-consumers-report-2013.html
http://www.nielsen.com/us/en/reports/2013/mobile-consumer-report-february-2013.html

Cumulonimble. Data backup. Cloud to cloud.

Even the most secure enterprise or data centre can be hacked or infected by a polymorphic malware attack, persistent and determined ‘black hat’ programmer or malicious staff member. So, file backup is of critical importance in all environments.

There could also be a recurrence of past worldwide infections, as polymorphic malware is now far more covert, complex and capable of continuous mutation.

With security as a major consideration, all Digital Tsunami dedicated servers have multiple layers of redundant security and data backup.

Firstly, the webservers are housed in a reputable data centre with extremely robust physical and electronic security systems.

Secondly, the servers are RAID arrays with multiple hard drives, load balancing and anti-virus software.

Thirdly, scheduled daily and weekly server backups are archived on duplicate servers and in offsite storage facilities.

Fourthly, all WordPress websites are managed with separate daily and weekly backups, also stored offsite and “in the cloud” for maximum security and redundancy.

All these precautionary measures enable rapid restoration of site content, immediately an incident is detected.

All client sites (on our servers or elsewhere), are dynamically monitored at two minute intervals. This ‘heartbeat monitoring‘ ensures that our technicians are notified rapidly if a domain is detected to be offline.

Online solutions are designed with a fundamental security measures, including: high-level passwords for all back-end and front-end users; device IP-specific logins for administrators; strict upload file type restrictions; integrated anti-virus software scans; and a CAPTCHA on all forms.

Digital Tsunami manages dedicated servers in the telco-grade, Global Switch data centre in Sydney, Australia and can configure your own dedicated server or co-locate in the continent of your target market, or on a content distribution network (CDN) for high-speed global data delivery.

We have provided assistance to companies with sites that have been hacked or defaced, domains which have been stolen, and even a community group which required a forensic audit to determine if a staff member had committed a criminal offence.

Read about our integrated WordPress web hosting services.

Contact Digital Tsunami today to discuss your specific web development requirements and security for your web hosting.

Download the Web Hosting datasheet (316kb PDF)

Facebook, brands, advertising and privacy

By now, you may have repeatedly heard that if Facebook was a country, it would be the third largest (by population) in the world.

Facebook is a massive platform for brands.

As a part of a customised eStrategy, Digital Tsunami counsels brands on the use of Facebook pages for their products and services, to access a global market of over a billion consumers.

Ever “Liked” a product, video or post? Apps are increasingly utilising Facebook users to collate, integrate and promote personal data and preferences. If an individual has not manually selected certain privacy settings, a brand can use that data as a recommendation or advertisement on Facebook.

Whilst brand advocates have contributed to the success of Facebook, there are also elements of privacy of which responsible corporations and sensible individuals must be cognizant.

This is not a new issue. MIT published a study “Facebook: Threats to Privacy” in 2005. At that time, approximately 12-22% of users actually revealed their cellphone numbers, with s a noticeable gender difference. Amongst the study respondents, (University students from Harvard, MIT, NYU and Oklahoma), women were less likely to publish their cell number.

More recently, Mashable published a Facebook privacy guide, and just yesterday, promoted SimpleWash, a cleansing agent to remove unwanted and negative content and even photo tags. Other resources exist to advise Facebook users on protecting their identifiable data, such as Reclaim Privacy.

The Wall Street Journal (WSJ) has published a comprehensive and easy-to-use guide to the privacy and security settings for individual Facebook accounts: “A Guide to Facebook’s Privacy Options“.

While brand managers will want to capitalise on brand advocates, as individual Facebook account holders, they may well want to protect their own privacy.
Read more about eStrategy
Read more blogs about Social Media
Read more blogs about Advertising and Marketing
Read more blogs about Statistics


References:
http://www.facebook.com/help/privacy
http://mashable.com/2011/02/07/facebook-privacy-guide/
http://mashable.com/2013/03/10/simplewash/
http://www.reclaimprivacy.org
http://allfacebook.com/facebook-privacy-settings_b31836
http://www.wired.com/business/2010/05/facebook-transparency-tool/
http://simplewa.sh

GreenTag™ Gold certification for Kembla

Australian copper pipe and tube manufacturer MM Kembla has attained GreenTag standard for a range of its products.

The certification was issued by Queensland company ecospecifier in accordance with the standards set by GlobalGreenTag. MM Kembla products certified all received a Gold rating.

Global GreenTag Pty Ltd is a third party green product certifier, which conducts rigorous scientific and Life Cycle Assessments (LCA) to rate and certify building products by providing them with a Global GreenTagCert™ rating.

The MM Kembla product ranges which have been GreenTag certified include:

  • Kembla Copper tube for plumbing, HVAC and refrigeration (straight lengths & coils)
  • Kembla Copper tube with PE & PVC lagging (Kemlag)
  • PairCoil standard (Refrigeration copper tube with PE insulation)
  • PairCoilMax (Refrigeration copper tube with NFR insulation)

To ensure that this information is readily available to architects, mechanical engineers and end customers, MM Kembla developed the mobile site kemblagreentag.com

Digital Tsunami developed the primary website for the company at Kembla.com

Rappin’ with the King and Queen

Musicians and performing artists are great users of social networks. The like / share / link functionality, the integraton of video, and the calls to action which link to websites and sales are ideal for promoting music.

Digital Tsunami client Ru C.L (a.k.a King Ru) has just released video via his Facebook page. The video was uploaded to Facebook and the Ru C.L website within days of being shot and edited.

Throughout 2012, Ru C.L travelled from Australia to the UK and Jamaica and used Facebook and other social networks to share thoughts, photos, videos and music with his fellow musicians, friends and fans.

Another recording artist engaging with her fan base is the New Zealand’s “Queen of Loops”, Mihirangi.

“I wanted to share this song with you all… it’s off the new album “Somebody Shake The Tree”… I’d love to get some feedback so in return I’m offering it as a FREE download for the next 48 hours… I hope you like… it’s one of my favourite songs on the album… ENJOY!”

Mihirangi gained her first ‘big break’ when she wowed “New Zealand’s Got Talent” judges with her live improvisational looping, using mutliple channel sampling and replaying. Many people outside New Zealand may have encountered her though YouTube where the video of her performance got traction, and discovered more on the Mihirangi website.

The impact and power of social networks  should not be underestimated. If the members of a social network were equated to a single country, Facebook would the the world’s third largest country by population!

Where consumers live, retailers and brands are sure to follow. Consider television ads for new movie releases. The URL at the end of these is now more likely tobe a Facebook page than a movie website.

Many corporates are also utilising social media as a part of an eStrategy to communicate with their stakeholders (internal and external), to promote brand advocates and engage in two-way conversation with their customers, critics and potential customers.

Digital Tsunami assists corporations to navigate the social media maze, determine which platforms are most suitable to your stakeholder engagement and prepare resources and content to contribute. This may include video, mobile sites or apps, and an all-encompassing social media profile.

We’ll listen to you, learn about your business, confirm your requirements and aid you to prepare an effective eStrategy for your brand.

Contact us today!

Companies can to connect with the World just as easily as a ‘King’ or a ‘Queen’.


*Source: TechCrunch “Pinterest Hits 10 Million U.S. Monthly Uniques Faster Than Any Standalone Site Ever -comScore” (February 7, 2012)